Role of Design in Tech Products: A 2026 Playbook

Design determines whether technology becomes usable, desirable, and commercially successful. Companies that score high on the McKinsey Design Index outperform industry-benchmark growth by as much as two to one. In the AI era, that advantage compounds: when implementation costs fall, the question shifts from can we build it to should we build it, making front-loaded design validation more consequential than ever. At Mytotaltake, we see this principle in every curated product we select. The pieces that earn lasting loyalty are the ones where design and function are inseparable.
Why design’s role is decisive right now:
- AI lowers the cost of building, so the risk of building the wrong thing rises proportionally.
- The Empathize→Define→Ideate→Prototype→Test framework keeps teams anchored to real user needs before a single line of production code is written.
- MDI data shows a 2:1 growth signal for design-mature companies versus peers.
Table of Contents
- What does design actually do in a tech product?
- How design fits into the product lifecycle and the product triad
- How do you measure design’s business impact?
- How does AI change the design question from “can we build” to “should we build”?
- A tactical playbook product designers can apply this week
- What do discovery, prototyping, and execution actually cost?
- What are the red flags that design is being sidelined?
- Short examples of measurable design impact
- Key Takeaways
- Design curation is a discipline, not a preference
- Curated tech products that show design principles in action
- Useful sources and further reading
What does design actually do in a tech product?
Design as a strategic discipline connects user needs to technical capability and business outcomes. It is not a visual layer applied at the end. It operates across five concrete functions:
- Usability: Reduces time-to-value by making task paths obvious. A well-structured onboarding flow can cut activation drop-off without changing a single feature.
- Desirability: Creates emotional resonance through aesthetics in gadgets and brand coherence. When technology matures and commodifies, desirability is what determines which product gets chosen.
- Accessibility: WCAG 2.2 compliance is not a checkbox. Products that fail accessibility standards lose users with disabilities and generate disproportionate support costs. Accessible design reduces churn across the board.
- Service design: Maps every touchpoint, from the first ad impression to the renewal email. Gaps between touchpoints are where trust erodes.
- Information architecture: Determines how users build a mental model of the product. Poor IA forces users to search for what should be obvious, which raises support volume and suppresses retention.
Pro Tip: Run a five-second test on your onboarding screen. If a new user cannot state the product’s primary action within five seconds, your information architecture needs revision before your visual design does.
How design fits into the product lifecycle and the product triad
According to NN/g’s product triad guidance, designers are the authority on user needs, helping teams make defensible tradeoffs between desirability, technical feasibility, and business viability. That authority only holds when design is present at every lifecycle gate, not just at delivery.
Lifecycle ownership by stage:
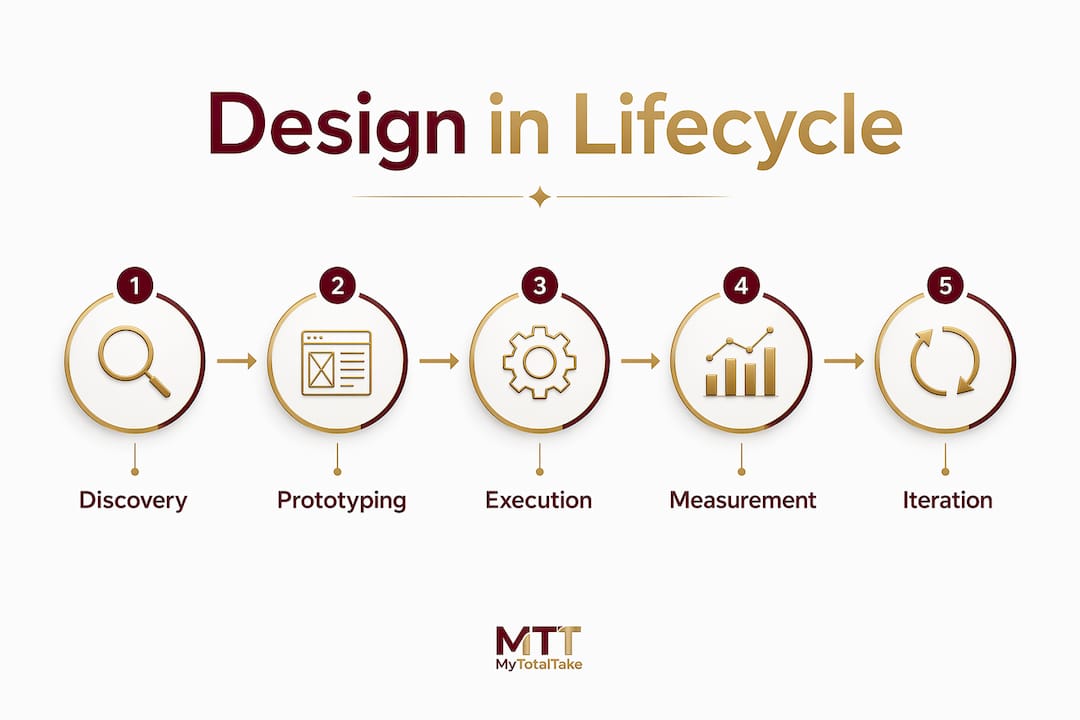
- Discovery: Designer leads user research, frames the problem statement, and defines success criteria. Output: research synthesis and a validated problem brief.
- Solutioning: Designer drives ideation and low-fidelity prototyping. Engineering assesses feasibility. Product management holds the business case.
- Delivery: Designer owns the handoff spec and participates in QA to catch implementation drift. Artifacts reduce rework.
- Iteration: Designer tracks UX metrics post-launch and proposes evidence-based updates.
Who owns what at each gate:
- Discovery gate: Designer signs off on problem framing; PM signs off on business fit.
- Build gate: Engineering signs off on feasibility; Designer signs off on interaction spec.
- Launch gate: All three triad members align on success metrics before release.
Pro Tip: If your team skips the discovery gate sign-off, you will almost certainly revisit the problem statement mid-sprint. A 30-minute alignment meeting at the start saves three days of rework at the end.
How do you measure design’s business impact?
The McKinsey Design Index finding is the clearest proof point: design-mature companies grow at up to twice the rate of peers. But to make that case inside your own organization, you need KPIs tied to design decisions specifically.
| KPI | Why it matters | How to measure | Baseline target |
|---|---|---|---|
| Activation rate | Shows whether onboarding converts sign-ups to active users | % completing core action within 7 days | Varies by product; track week-over-week trend |
| Task success rate | Confirms users can complete key flows without help | Moderated usability test completion % | 78%+ is a common practitioner benchmark |
| Time-on-task | Reveals friction in critical paths | Median seconds to complete a defined task | Establish baseline, then target reduction |
| NPS | Captures overall experience sentiment | Standard 0–10 survey | Positive trend after design changes |
| Support ticket volume | Quantifies confusion in the product | Tickets per 1,000 active users | Decline after UX improvements |
| Rework rate | Measures design-to-engineering alignment quality | % of shipped features requiring redesign within 90 days | Target below 15% |
Experiment checklist for tying design changes to business outcomes:
- Define one primary metric and one guardrail metric before the test begins.
- Set a minimum detectable effect and calculate the required sample size.
- Run the A/B test for at least two full business cycles to avoid day-of-week bias.
- Document the design hypothesis in writing so the result is falsifiable.
- Share results with the full product triad, not just the design team.
How does AI change the design question from “can we build” to “should we build”?
AI makes implementation cheaper, but quality still costs. The risk is building features that solve internal technical curiosities rather than validated user problems. Front-loading the Empathize and Define phases is the direct counter to that risk.
Ethical checklist before any AI-assisted feature ships:
- Data privacy: Is user data used for model training disclosed and consented to?
- Bias testing: Has the model been tested across demographic groups for disparate outcomes?
- Transparency: Does the user know when they are interacting with an AI-generated response?
- Guardrails: Are there defined failure modes and fallback states when the model is wrong?
- Reversibility: Can the user override or correct the AI’s output without friction?
Pro Tip: Build your AI prototype around the user’s goal, not the model’s capability. A paper prototype that tests whether users understand what the AI is doing tells you more than a polished demo of what the AI can do.
A tactical playbook product designers can apply this week
Design thinking’s five-phase framework prevents teams from building the wrong thing. Here is a compact version you can start Monday.
Five-day research sprint:
- Day 1: Write a one-sentence problem statement using the format “How might we help [user] achieve [goal] so that [outcome]?”
- Day 2: Conduct five user interviews. Five users typically surface the majority of critical usability issues.
- Day 3: Synthesize findings into an affinity map and identify the top three unmet needs.
- Day 4: Sketch three low-fidelity concepts. No Figma yet. Paper or whiteboard only.
- Day 5: Run a five-person moderated usability test on the strongest concept. Document pass/fail per task.
Tool categories to cover your workflow:
- Research repository: Dovetail or Notion for storing and tagging interview notes.
- Prototyping: Figma for mid-to-high fidelity; Balsamiq or paper for low fidelity.
- Analytics: Mixpanel or Amplitude for behavioral data post-launch.
- Participant recruiting: UserTesting or Respondent for finding screened participants quickly.
Design thinking artifacts fed into development pipelines reduce rework by creating a shared source of truth for engineering and product. Store all artifacts in a shared workspace, not a designer’s local drive.
Pro Tip: For AI-native workflows, effective prototyping focuses on validating the problem and user intent rather than demonstrating backend capability. Test the concept before you build the model.

What do discovery, prototyping, and execution actually cost?
| Phase | Typical timeline | Key cost drivers |
|---|---|---|
| Discovery | 1–4 weeks | Researcher days, participant incentives, synthesis time |
| Prototyping | 1–3 weeks | Designer hours, tool licenses, test sessions |
| High-fidelity implementation | 4–12+ weeks | Engineering hours, QA cycles, accessibility audit |
Factors that push costs up:
- Undefined or shifting problem statements mid-sprint.
- Skipping low-fidelity prototyping and going straight to high-fidelity.
- Late-stage accessibility remediation (far cheaper to build in from the start).
- Poor handoff documentation requiring engineering to re-ask design questions.
Factors that keep costs down:
- A validated problem brief before any design work begins.
- Modular design systems that reuse tested components.
- Continuous discovery practices that reduce big-batch research cycles.
What are the red flags that design is being sidelined?
Design maturity correlates directly with business outcomes. The Design Ladder frames organizations from no-design to design-as-strategy. Most teams that underinvest in design do not know it until the symptoms are expensive.
Red flags and quick fixes:
- Skipping research: Fix this week by scheduling two user interviews before the next sprint planning session.
- Visual-only design added late: Fix by requiring a design brief at the discovery gate, not the delivery gate.
- No measurable success criteria: Fix by adding one UX metric to every feature ticket before it enters the backlog.
- Siloed decision-making: Fix by including a designer in every product triad review, not just design reviews.
- High rework rate: Fix by auditing the last three shipped features for design-to-spec drift and tracing the root cause.
Organizational signals of chronic underinvestment include design being reported into marketing rather than product, no dedicated research budget, and designers brought in only for visual polish after engineering has already scoped the solution.
Short examples of measurable design impact
These composite examples reflect patterns seen across product teams. They are illustrative of replicable approaches, not specific client cases.
Example 1: Onboarding redesign
A SaaS team noticed that 60% of new sign-ups never completed the core setup flow. After a five-day discovery sprint, they identified that users did not understand what the product did at the moment they were asked to configure it. A single copy and layout change to the first screen, tested with eight users, lifted setup completion by a meaningful margin within 30 days. The minimum dataset needed: funnel analytics and five moderated sessions.
Example 2: Support volume reduction
A consumer app was generating high ticket volume around one specific feature. Usability testing revealed that the icon used for that feature was consistently misread. Replacing the icon and adding a one-line label reduced related tickets noticeably within two weeks of release. No new engineering work was required.
Both examples share the same pattern: a small, targeted design intervention, validated with real users before full implementation, producing a measurable outcome tied to a business metric.
Key Takeaways
Design is the strategic function that converts technical capability into products users adopt, trust, and return to, and companies that treat it as a core pillar grow at up to twice the rate of peers.
| Point | Details |
|---|---|
| Design drives measurable growth | McKinsey Design Index leaders outperform industry benchmarks by as much as 2:1. |
| Validate before you build | Run a five-day discovery sprint and prototype before any production code is written. |
| Measure design with KPIs | Track activation, task success, NPS, and rework rate to prove design’s business value. |
| AI raises the validation stakes | Lower build costs increase the risk of building the wrong thing; front-load Empathize and Define. |
| Mytotaltake applies this lens | Every curated tech product on Mytotaltake is selected for design quality, usability, and lasting craftsmanship. |
Design curation is a discipline, not a preference
There is a tendency in product circles to treat design as the final argument when everything else is equal. I think that framing undersells it and, frankly, gets the sequence wrong. The teams I find most credible are the ones where design is present at the problem statement, not the solution review. They are not asking “does this look good?” They are asking “does this solve the right thing, for the right person, in a way they will actually use?”
What strikes me about the role of design in Silicon Valley and beyond is that the products with genuine longevity are the ones where usability, craftsmanship, and intent are unified from the start. That is exactly the standard we apply at Mytotaltake when curating tech products. We are not interested in what is technically impressive in isolation. We are interested in what is designed to be lived with.
Curated tech products that show design principles in action
The principles in this guide are not abstract. You can see them expressed in physical products: the weight of a well-balanced device, the clarity of a single-purpose interface, the finish that holds up after two years of daily use. Mytotaltake curates premium tech gadgets selected precisely for these qualities, not for spec sheets alone.

Every product in our collection is evaluated for usability, craftsmanship, and design coherence. If you want to understand what good design looks like as a physical object, our guide to choosing upscale products that last is the clearest place to start. Browse the collection and see the standard for yourself.
Useful sources and further reading
The sources below back the claims in this article and are worth reading in full for deeper evidence.
| Source | What it covers | Relevant sections |
|---|---|---|
| McKinsey Design Index (AMA summary) | Financial outperformance of design-mature companies | Measurable impact, BLUF |
| NN/g: The product triad and design’s role | Designer authority on user needs; triad collaboration | How design fits, playbook |
| Forbes: AI makes software cheaper; quality still costs | AI-era validation imperative | AI and ethics |
| Design Research Society: Design as a strategic function | Design’s strategic role in organizations | What design does, how design fits |
| Nitrix-reloaded: Design thinking in the age of AI | Five-phase framework; AI prototyping heuristics | Playbook, AI and ethics |
| AI-native design workflow playbook (Maxence) | Prototyping for intent validation in AI workflows | AI and ethics, playbook |
| Microsoft HVE Core: Design Thinking Guide | Artifacts and handoff practices that reduce rework | Playbook, timelines |
| Start-Up Nation Central: Design maturity report | Design Ladder and maturity correlation with outcomes | Pitfalls, measurable impact |
| Live from Silicon Valley: Design in tech innovations | Design’s effect on adoption, retention, pricing power | What design does, perspective |










Leave a comment